Real Estate Market Intelligence March 2025

Real Estate Market Intelligence
March 2025
With so much news swirling around daily, it's hard to believe that it has only been two months into 2025. Lots to unpack this month starting off with the on & off tariff that has shaken the market confidence, Canada's "unchanged" unemployment rate at 6.6%, along with the Bank of Canada's rate cut decision and tariff contingency plans. Let's take a deeper dive.
For the Canadian real estate market, US tariff news continue to wreck psychological havoc and froze the market. Widespread uncertainly is causing many Buyers to retrieve to the sidelines, while Sellers are looking to list their homes (especially condos). In Vancouver, the February sales were -28.9% below the 10 year average, while total inventory is +36.4% above the 10 year average. If we look closely, this past month had the least February sales since 2019, and was only the 4th lowest February sales since the Global Financial Crisis back in 2009. Overall, the market sentiment is slow and buyer/sellers continue to be polarized; Buyers think the market price keep tanking this year, while the Sellers wait for the market to recover. Another trend that's emerging since Jan 2025 is market divergence, where single house and townhouse face balanced supply with flat pricing, compared to condo/apartment segment where supply is plentiful and causing downward price pressure. As the condo segment is now filled with investors-turned-Sellers, the abundance in supply has created a favorable Buyer's market that had not been seen in a long time. For condo Sellers who are faced with fierce competition, only those who are either priced competitively or has a really good product will be able to move their home now.
On the economic front, Canada's unemployment rate remains unchanged at 6.6%. When we take a closer look, February only created 1,100 jobs and fell way short of the economists expectation and well below from 76,000 jobs from January. All the uncertainties has put Canadian companies on a hiring freeze. Moreover, Royal Bank of Canada, the largest company in Canada, has just initiated layoffs after the acquisition of HSBC. Good thing is that there has yet to be massive layoffs across the board, but "restructuring" is definitely in the pipeline. I wouldn't be surprised if the Federal government, who's ran a $60.9 billion deficit last year, will be looking to reduce the government's workforce. On the same note, if Canadians are concerned about their job security and putting food on the table, then purchasing real estate is just an afterthought. Ironically, Buyers who have been waiting a long for the rate to drop, have now entered an lower rate environment, but is still waiting. Why? Well, one of the recipes for good rates to happen is when the economy is bad. Some Buyers who have a stronger and steadier job security would move into the market, but the average blue collar Canadian will think twice.
With the latest Bank of Canada rate cut at 0.25%, it is a good sign for variable rate holders. I expect there will be more rate slashes ahead, and we may possibly see rates reach bottom in the summer. As hard as predictions are, and only 3 weeks ago, the market put odds of Bank of Canada's chance of rate cut at 24%. Markets are so volatile and are moving at speed never seen before. Historically, it will take at least 2-3 months AFTER the dust settles before real estate Buyer regain their confidence and make a move. Question is, when does the dust settle, or has the storm just begun? Right now, your bets are as good as mine.
Some of the unique trends I've been observing:
1. Whether tariff are on or off, Canada's economy and business module will need a facelift. One of those is the inter-provincial trade barrier, which was estimated at approximately $200 billion. The US tariff is certainly a wake up call, and perhaps a blessing in disguise if Canada can find alternatives to replace US. For example, the Alberta premier is now seeking global Buyers their heavy oil. Whether Canadians like it or not, more changes will come.
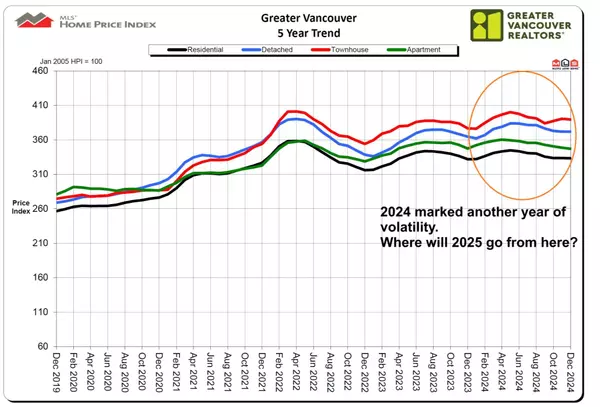
2. The Vancouver real estate was frothy in February, with monthly sales -28.9% below the 10 year average, while total inventory is up +36.4 above the 10 year average. The spread of the two is an astonishing 65.3%. Benchmark price fell slightly by -1.1% compared to a year ago. Market divergence is becoming prominent, with the condo segment seeing near all time high supply (especially in Fraser Valley). Single house and townhouse also had its highest inventory in the month of February since the pandemic 5 years ago.
3. In line with the expectations, the Bank of Canada has slashed the rate again for the seventh consecutive time by 0.25%, effectively bringing the overnight rate to 2.75%. Variable rate holders may finally feel they have redeemed themselves after having stuck with higher interest rate for the past 2 years. Fixed rate is still unpredictable. Expect variable rate to keep dipping and possibly touch the bottom this summer.
4. Canada's February unemployment rate remain unchanged at 6.6%, even though the economy is feeling more fragile than that. Looking closely, only 1,100 jobs were created in February compared to 76,000 jobs created a month earlier in January. Most companies are on hiring freeze, while Royal Bank of Canada has just announced layoffs after the HSBC acquisition. Even though the Canadian government refuses to call this a recession, most Canadian feel it already.
5. As much as we are exhausted from tariff news, it affects Canadian provinces in different ways. The highest reliance of US trade provinces are New Brunswick (seafood and forestry), Alberta (energy), and Ontario (steel and aluminum), whereas British Columbia is only affected moderately (forestry, manufacturing, and movie). Canada is in the same storm, but provinces are on different boats, and some areas, like Ontario, will be hit harder. Expect that to have a ripple effect on the Toronto real estate market, which is already in a bad shape.
6. Lost in all the news is BC's NDP government annual budget deficit of $10.9 billion, the highest ever on record. Is the NDP's way of reducing debt is simply spending more?
Here are the 3 highlights for February:
- Total inventory of 12,479 units is the highest February total inventory for the past 10 years.
- February is typically the time when Buyers come out of hibernation. However, the tariff news has kept Buyers sidelined.
- Prices continue to tread sideways for the past three months, with average prices barely moving at -0.3% since December.
Here are the in-depth statistics of the February:
- Last month's sales were -28.9% below the 10 year February's sales average.
- Month by month residential home sales increased by +14.1% from January 2025.
- Month by month new home listings has oddly dropped by -14.7% compared to January 2025. This was due to the higher-than-usual number of new listings in January, which was the highest in past 20 years.
- Last month's price remain nearly flat at -0.3%.
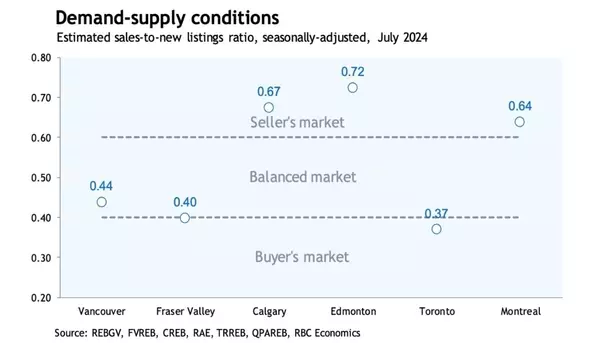
- Sales-to-listing (or % of homes sold) ratio is dropped slightly to 14.8% (compared 14.1% in January). By property type, the ratio is 10.7% for single houses, 18.5% for townhouses, and 16.8% for apartments/condos.
Download February 2025 Vancouver Real Estate Market Report
Single House Market
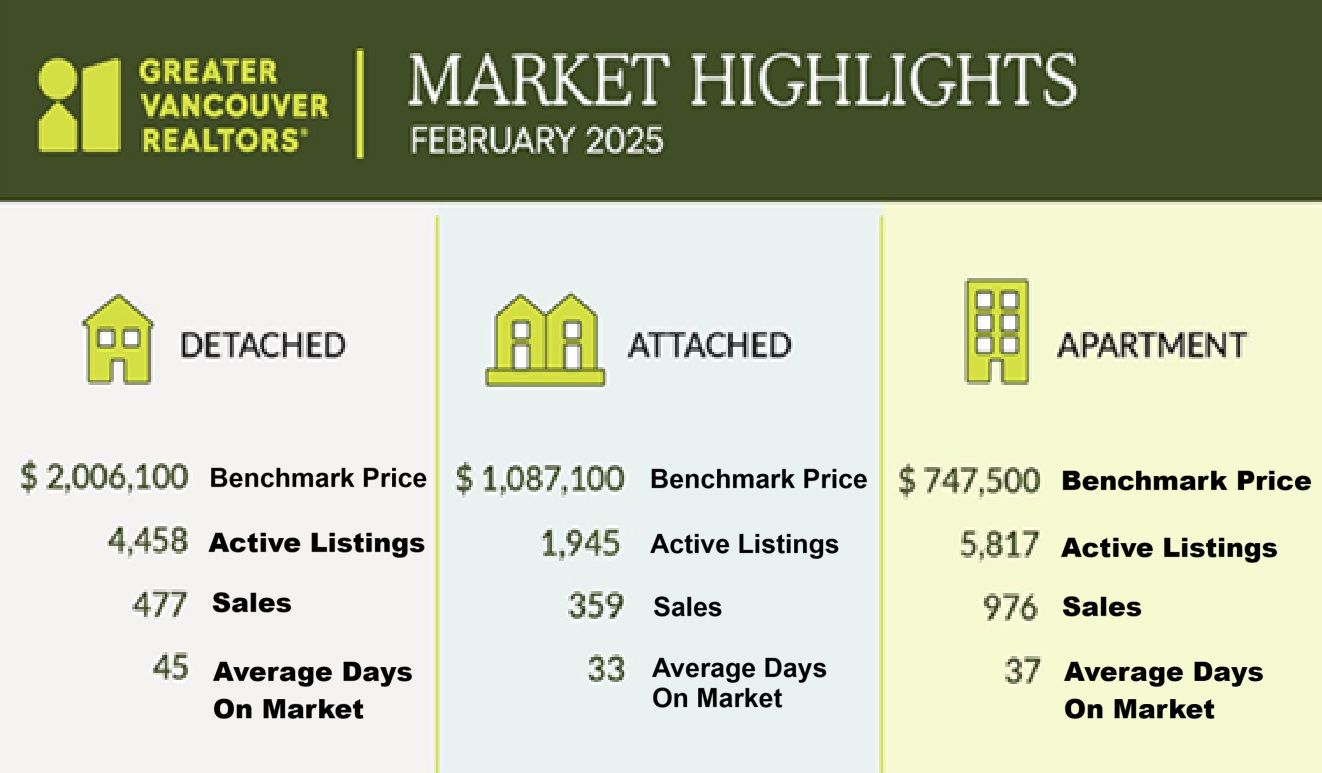
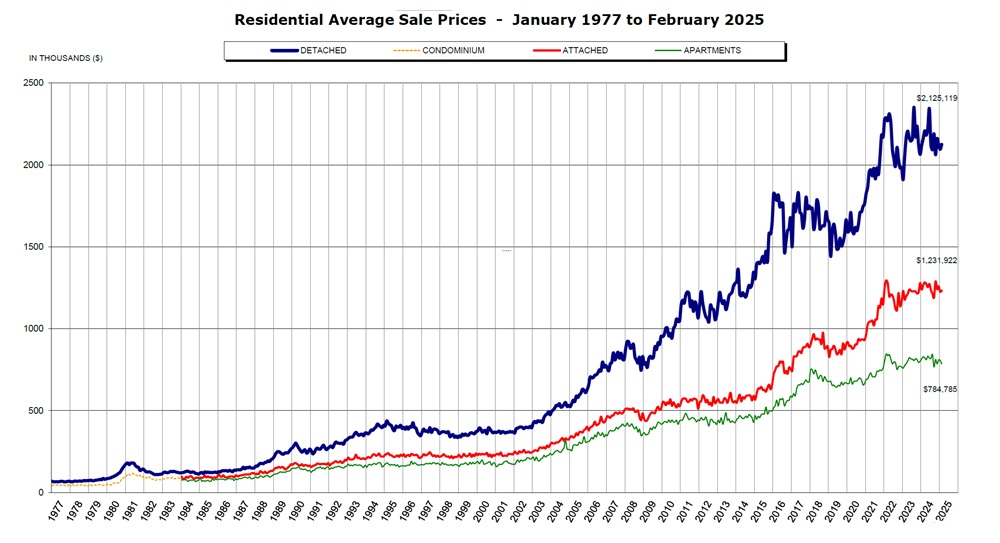
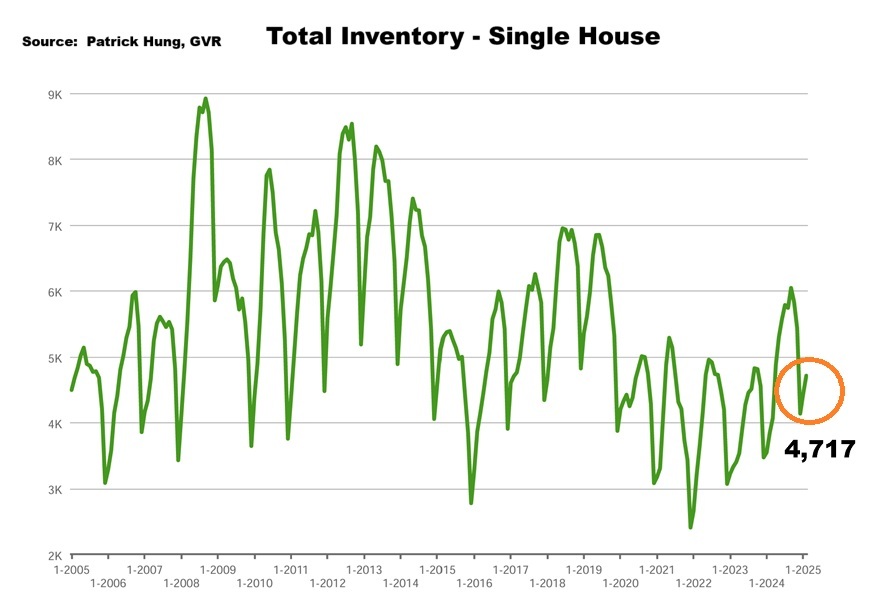
Even with the rising home inventory, the single house segment seem to have been cushioned for the blow, for now. Even though overall single house total inventory is rising, the new listings are near all time low. With new supply slipping off, this has effectively created a price floor. Good products hold value in times of good or bad, and for the Greater Vancouver single houses where land is scarce, this has withstood the testament of time. Again, some may argue that price is a lagging indicator, and it may take months before downward price pressure sets in for single homes. I would argue that as the BC government continue to encourage developments of apartments, rental homes, multi-plex and townhouses, it's hard to see a hard drop in price for the single house. Even as sales-to-listing ratio (% of homes sold) for single house remained in a Buyer's market at 10.7% (compared to 9.2% in January), it feels like these Sellers are holding their ground. What's different this year from the last is that the single house inventory is now reaching a balancing point, even with less Buyers. When the rates drop, it may attract some small to medium sized developers sees this as an opportunity to snatch up land to rezone. Off all property types, single house seem to have the strongest footing amongst and can weather the current tariff storm.
For the month of February, the neighorhoods that registered most price growth were Tsawwassen, Bowen Island and Vancouver West, at +3.3%, +3% and +1.9% respectively. Conversely, the neighborhoods registered the most significant price drops were Whistler, Squamish, and Pitt Meadows, with -9.6%, -6.1% and -5.4% respectively. The single house market has shifted remained in a Buyers market, with average days on market dropping significantly to 45 days (compared to 64 days in January), and month-to-month average price remained unchanged. Sales-to-listing ratio (% of homes sold) remain increased slightly to 10.7%. (compared to 9.2% in January).
Townhouse Market
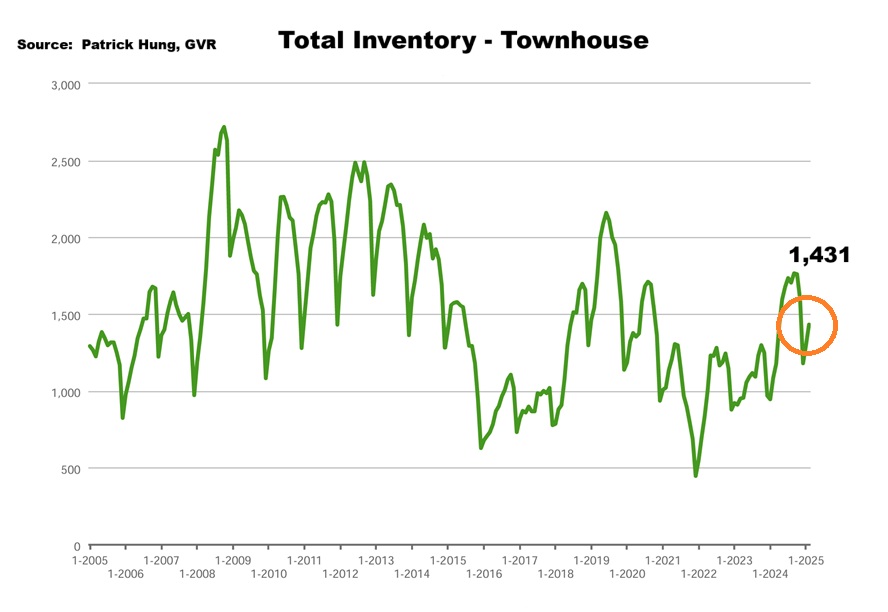
On the surface, it looked like the townhouse market took a major hit in Greater Vancouver, registering -1.7% in monthly price loss. When we dig deeper, it was only the neighborhoods in the outskirts, such as Whistler, Sunshine Coast, and Squamish, that took massive hits of -15%, -14.8% and -14.6% respectively. For one thing, it could be due to seasonality, but I do believe a divergence is taking shape in this segment; the suburbs such as Langley, Surrey, Abbotsford, and Chilliwack are facing a steeper price correction due to abundance in supply and a drop in demand. During the pandemic in 2020-2022, the environment of working from home has created an explosion of demand in the aforementioned suburbs. Prices shot up by as much as 30% within two years, and developers jumped into the scene to build and capitalize on the opportunity. Fast forward to now, and the back to office mandate has got people whining about the commute between office again. The abundance of newly constructed townhouse in the suburbs has kept a price ceiling for the re-sale townhouse. Of all the factors, the most important one would be that the suburbs townhouse owners are mainly made up of blue collar families. When the Canadian economy tanks or the unemployment rate rises, they are affected the most.
Compare the above with the Metro Vancouver townhouse, the difference is obvious. Prices are holding firm and supply is falling. The building cost is just way too high for developers to swallow, so new construction are near a all-time low. When there are hardly any new constructions, it easily creates this price floor for Metro Vancouver townhouses. For example, Burnaby (composed of North, East and South) posted +0.2%, +4.9% & +4.9% gains in February respectively, which averaged out to be 3.3%. Another neighborhood, Richmond, posted minor dip of -0.2%. As such, it does seem like the Metro Vancouver household income dynamic are stronger and is less prone to be affected by cyclical changes in the economy. In short, they (or their parents) have deeper pockets that can weather the storm. It is very likely that this neighborhood divergence will continue in the near future. It is noteworthy that townhouse demand can return quickly, so this market can really turn on a dime. The lower rates will add fuel to this.
In February, the areas with the most townhouse price growths were led by Burnaby East, Burnaby South and Port Coquitlam, registering +4.9% (tied for 1st) & +3.5% respectively. Conversely, the neighborhoods with the negative price growth were in the outskirts such as Whistler, Sunshine Coast and Squamish, at -15%, -14.8% and -14.6% respectively. The townhouse market remained in a balanced market, with days on market dropping substantially to 33 days (compared to 44 days in January). Month-to-month sale price continue to trend down for the second month at -1.7% (compared to -0.8% in January). Sale-to-listing (% homes sold) ratio remain the nearly unchanged at 16.8%. (compared to 16.5% January).
Apartment and Condo Market
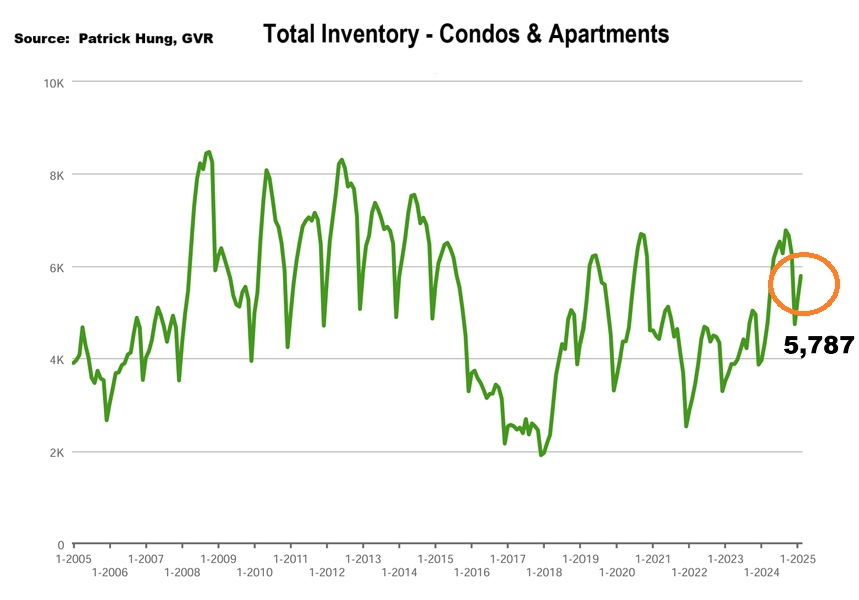
Both January and February saw total inventory +35% over the 10 year average, and this was mainly spearheaded by the condo segment. Whether it is Metro Vancouver or the suburbs, there are just so many condo listings now that an price correction is imminent. As price is a lagging indicator, it will take 2-3 months before the price drop to take effect. My colleagues have been reporting much fewer condo showing request and traffic during open house. With all the economic uncertainties, the condo segment has been hit the hardest. Investors-turned-Sellers are now dumping their home as they no longer see condos as an viable investment option. In fact, many are bleed cash every month as the asking rent fell for the 5th consecutive month in Canada, and is the lowest since July 2023. As investors continue to liquidate their condos, competition will get fierce. Sellers would be left with a bitter choice, whether to sell now below their desirable price (compared to a year ago), or get a new tenant and bleed cash of $700-1000 per month. In short, condo listings are sitting on the market longer, and rentals are taking up to 3 months or more to find a qualify tenant. On the flip side, for those first time home buyer looking for condos, this has posed one of the most favorable times to buy in recent history.
For the month of February, the best performing neighbourhoods for apartments are North Vancouver, West Vancouver and New Westminster, at +2.5% +2.2% and +1.2% respectively. Conversely, the areas with the most significant price drops were all in the outskirts in Whistler, Squamish and Sunshine Coast with -10.5%, -9.8% and -8.5% respectively. The apartment and condo segment remained in a balanced market for the third month, with average days dropping to 37 days (compared to 45 days in January). Month-to-month sale price remain nearly flat again at -0.1% (compared to -0.2% in January). Sale-to-listing (% homes sold) ratio also remained nearly flat at 16.8% (compared to 16.5% in January).
Here are the Three Trends I'm Observing:
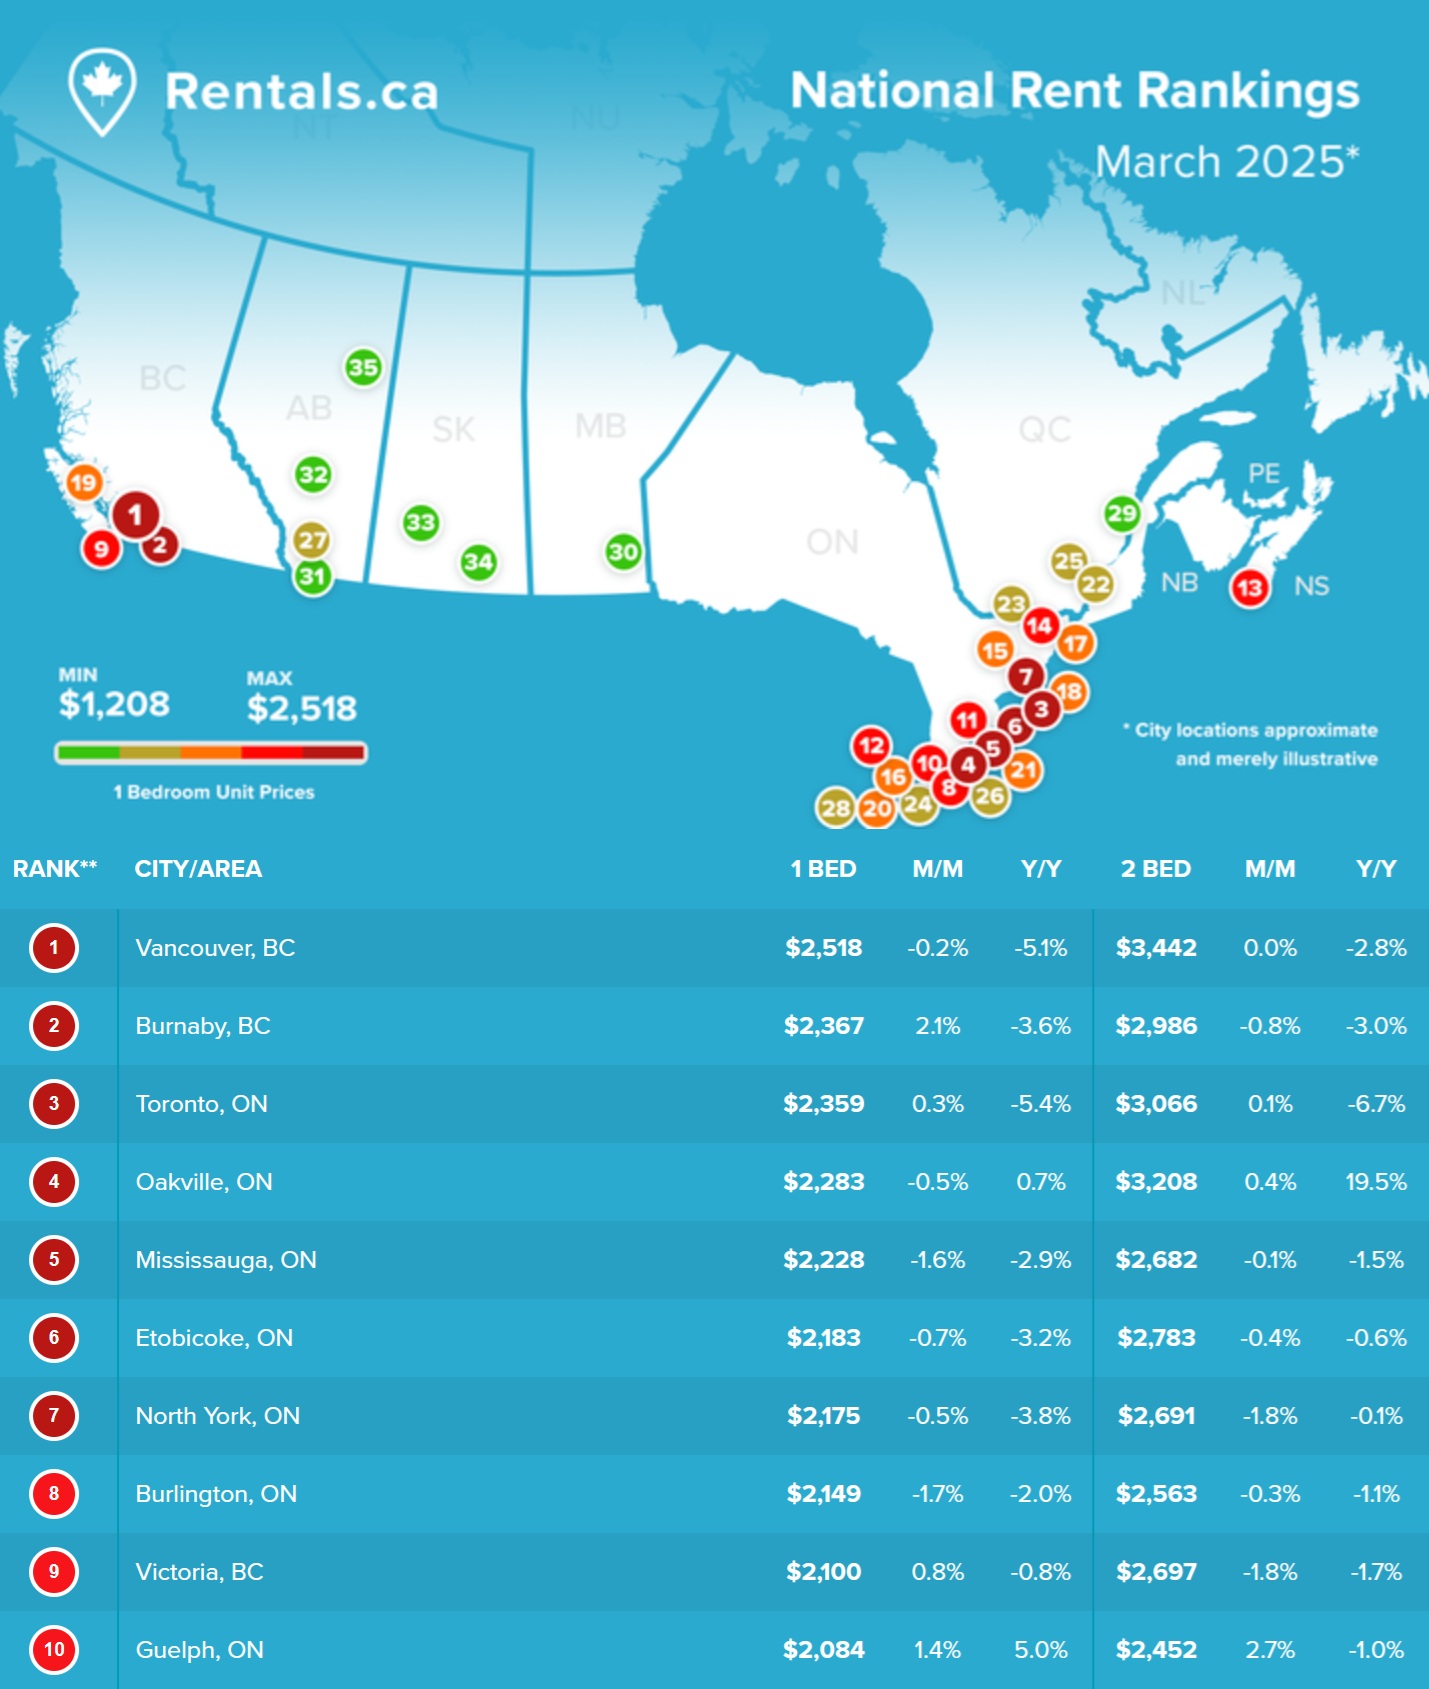
1. Hurt Locker
Average asking rent in Canada has dropped for the fifth consecutive month in February, falling 4.8% to $2,088, which is the lowest since July 2023. Rental managers are reporting much longer time to rent, and the quality of the tenants are also dropping. Even with more rate cuts on the horizon, just how does a near-zero immigration policy and a continuous falling rent environment justify any investor to make a move now? When investors confidence are hurt, it may take a long time before they return. Or will they? (Source: Rental.ca)
2. Off A Cliff
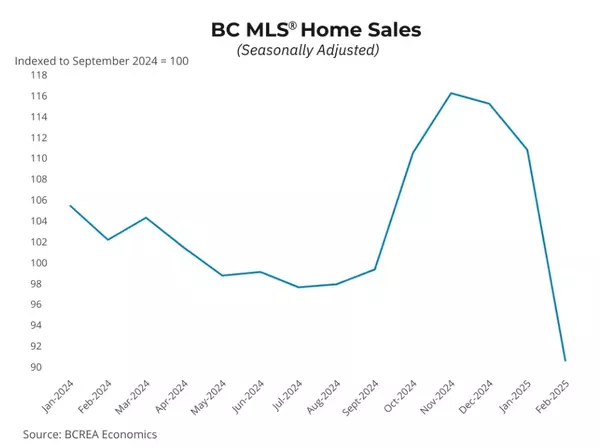
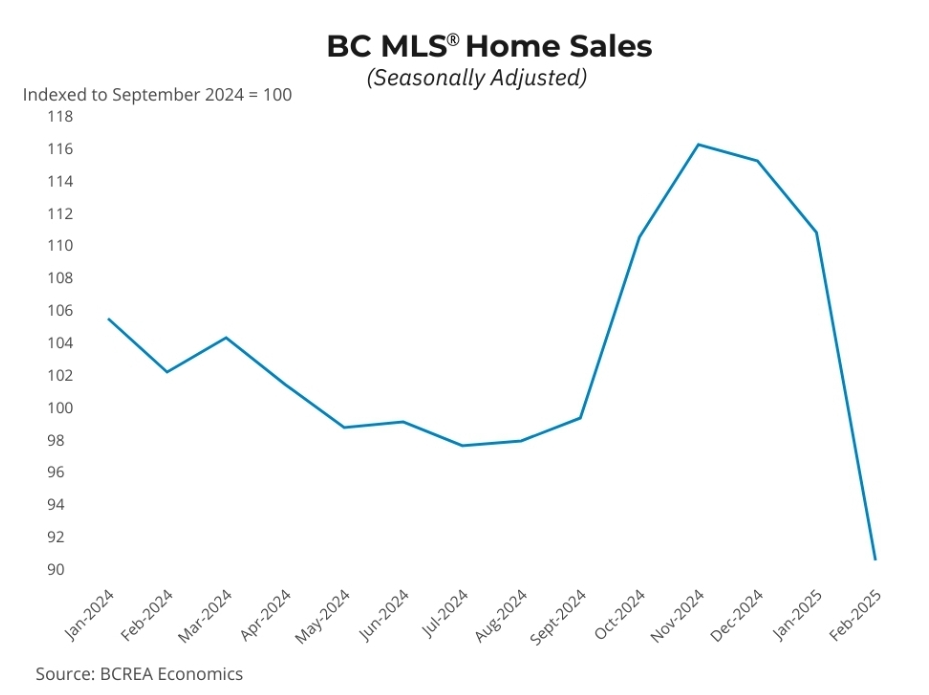
Housing sales fell off a cliff right after the new US president took office on Jan 19, 2025. The Vancouver real estate market feels frozen, and Buyer sentiment are hitting lows close to that of a recession. (Source: BCREA Economics)
3. Epicentre
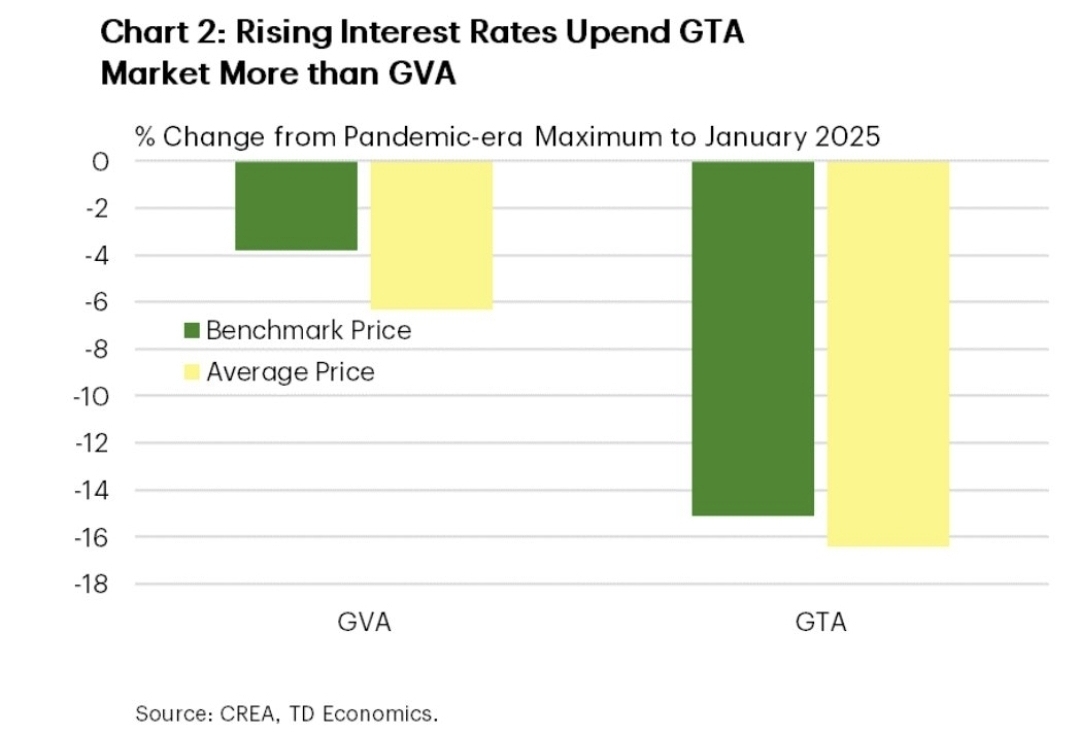
When talking about Canadian real estate, most people are referring to the two biggest markets: GTA (Greater Toronto Area) and GVA (Greater Vancouver Area). Since the peak in 2022, the real estate in Greater Toronto area has dropped -16%, while the Greater Vancouver area only at -6%. With Toronto being the epricentre of this, and as bad as it looks, it seems like there's more hurt to come. (Source: CREA, TD Economics)
Recent Posts
